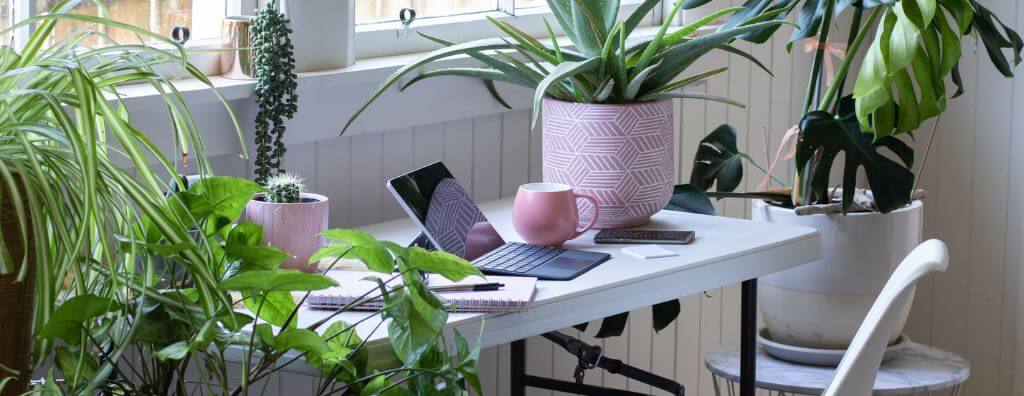
Interior design solutions come in all shapes and sizes. After all your furniture items, art, and other physical items are all in their right place, decorating with house plants can provide the perfect final touch. The best plants for your home are the ones that will thrive in your local climate while complementing your existing décor. Here are a few common house plants and their corresponding interior design styles to aid your decorating efforts.
Decorating with House Plants to Match Your Décor Style
Mid-Century Modern
Mid-century modern interior design is ubiquitous, and for good reason. Its simple concepts, open spacing, and emphasis on natural elements make it one of the premier interior design styles for homeowners and design experts alike. A Split-Leaf Philodendron, or “Swiss cheese plant,” is ideally suited for these interior spaces, and its signature leaf holes make it a visual focal point. Swiss cheese plants will thrive in open spaces with access to natural light, climbing toward the ceiling as space allows. For the same reasons, Fiddle-Leaf Figs feel at home in a mid-century modern aesthetic.
There’s an inherent give and take with industrial interior design in that it foregoes traditional elements that we associate with comfort for stylistic choices that create a strict-yet-visually appealing environment. Decorating with house plants can add vibrance to an industrial backdrop of wood, steel, brick, stone, and copper without compromising the edginess of the style. Both Snake Plants and Cast Iron Plants will harmonize with an Industrial space. Both are low-maintenance plants that mesh well with materials that evoke toughness and durability.
Minimalist
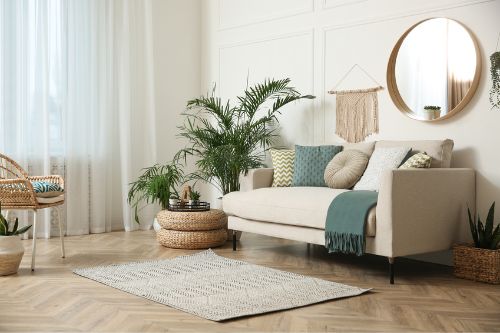
The combination of minimalism and house plants is a match made in heaven. Given minimalism’s focus on the reduction of waste and clutter and the importance of bringing the outdoors in, all signs point toward decorating with house plants. Being selective about which plants you include will keep everything in line with the fundamental concepts of minimalism—too many plants and things would easily feel off balance. Large-leaf plants are a perfect solution for minimalist decorators, such as Rubber Plants, Bird of Paradise, and Silver Evergreen.
The Farmhouse interior styleprioritizes cleanliness and an inviting spirit. Its white-washed backdrop of whites, grays, and beiges makes it a fitting canvas for the lush green additions that a selection of house plants can provide. Spider Plants work well to fill shelf space, which come in both solid green and white-striped varieties. These plants are easy to take care of and thrive in partial sun or shade. Aloe Vera plants in the kitchen can refresh the look of your shelving or counter space.
Homeowners withtraditionally styled interiorshave a whole host of options to choose from. Any classic plant species will complement its traditional surroundings, but more specific choices can bring out the uniqueness in your home. If your decorations are rife with patterns and geometric shapes, perhaps a fern or Amazon Lily would help to balance the room. Bamboo may be a natural fit for your home depending on your existing décor. If you’re looking for a hanging display to fill empty wall space, consider Devil’s Ivy.
As always, research the watering and sunlight needs of a house plant before bringing it into your home. For more on decorating with house plants, be sure to read our room-by-room guide:
A sun-drenched home in Somerset offers southern exposure and golf course views, streaming with light. Traditional two-story floor plan with fully finished daylight basement. Plenty of room for all with 5 bedrooms, 3.5 baths, and 3860 sq ft. The kitchen with eating space opens to the family room and spacious deck overlooking the view. Formal living room and dining room. Primary en-suite with walk-in closet, vaulted ceilings, and updated bath. The lower level includes a guest suite and a huge bonus room ready for game day or movie night! Fenced flat backyard. All this plus Bellevue’s top schools, Somerset, Tyee Newport. Check it out!
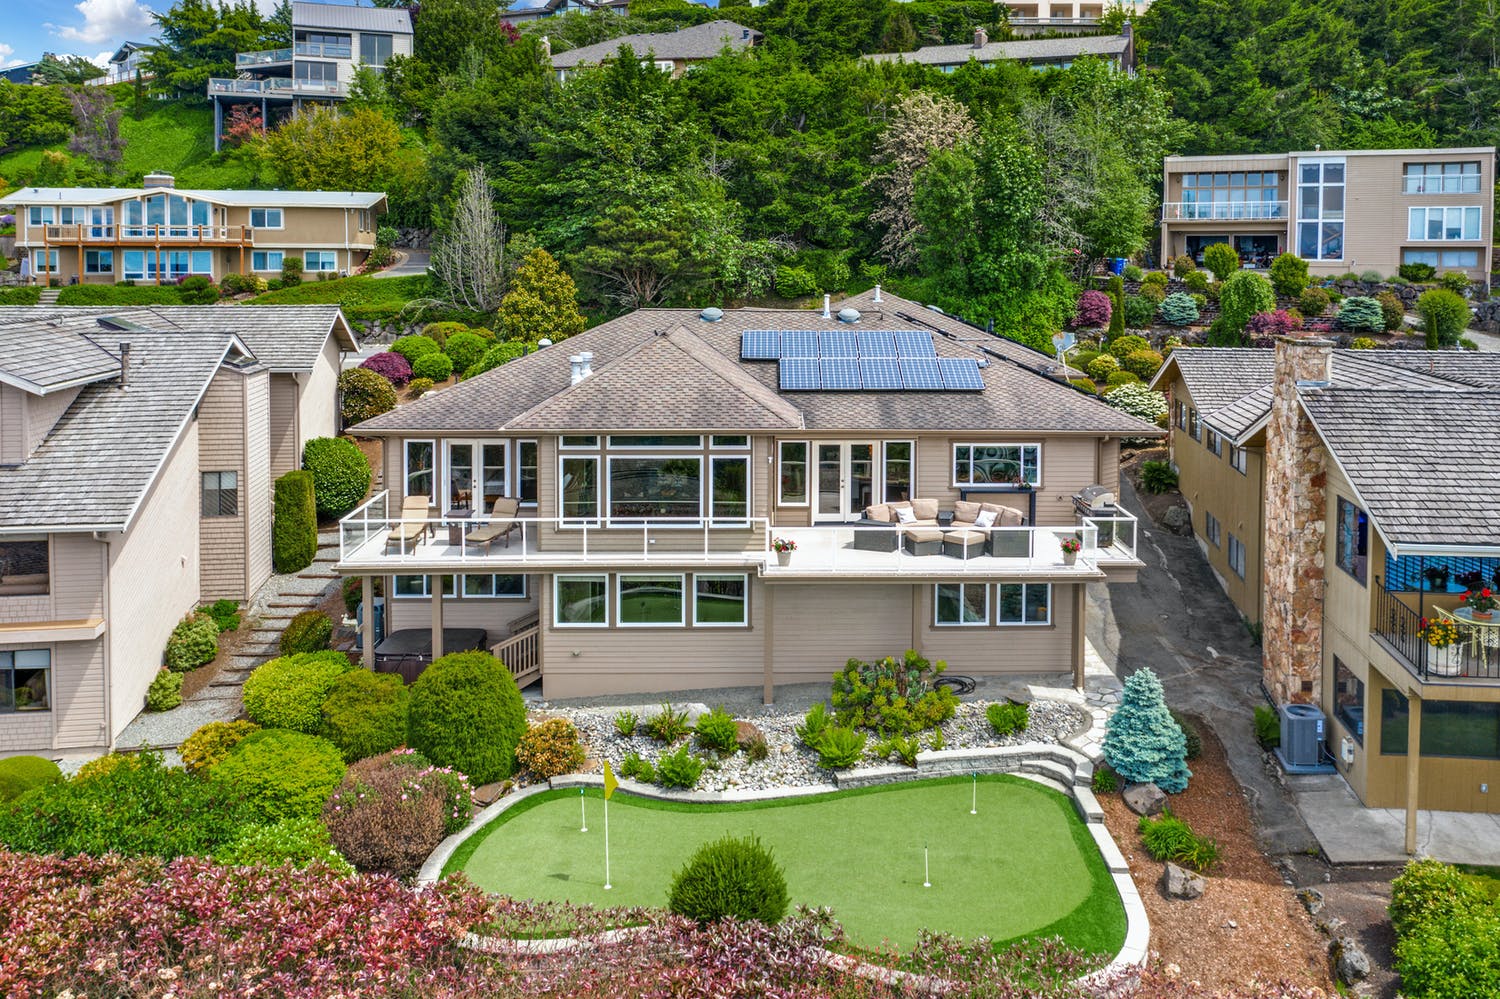
Nestled on one of the most desirable streets, this sophisticated & elegant NW traditional home features expansive views with total privacy. Enjoy everyday living & entertain effortlessly with sweeping city, lake & mountain views from practically every room. Just a few of the notable finishes: natural cherry cabinetry, chef’s kitchen with high-end appliances, high ceilings & walls of windows. Generous primary suite with stunning views & spa-like en-suite bath. Complete w/3 additional bedrooms, office, huge bonus room & more. Mature landscaping, putting green & expansive decks create an outdoor sanctuary. Wonderful community, convenient to everything including top Bellevue Schools. You’ll love it here!
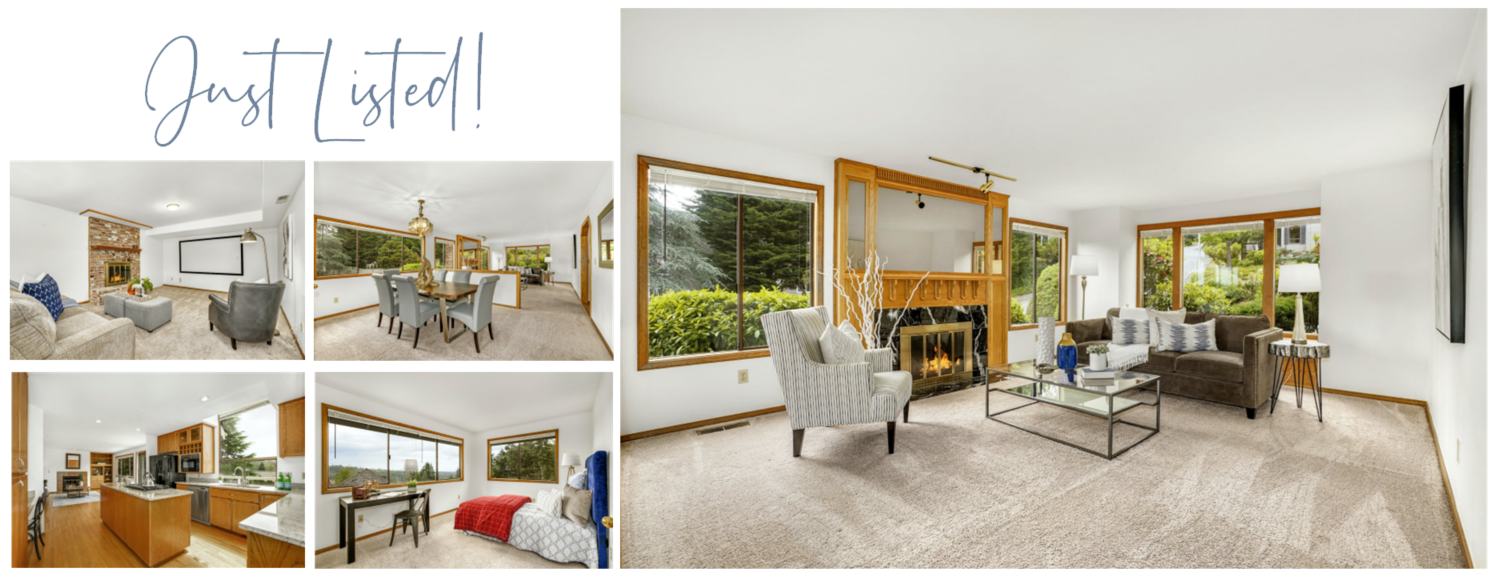
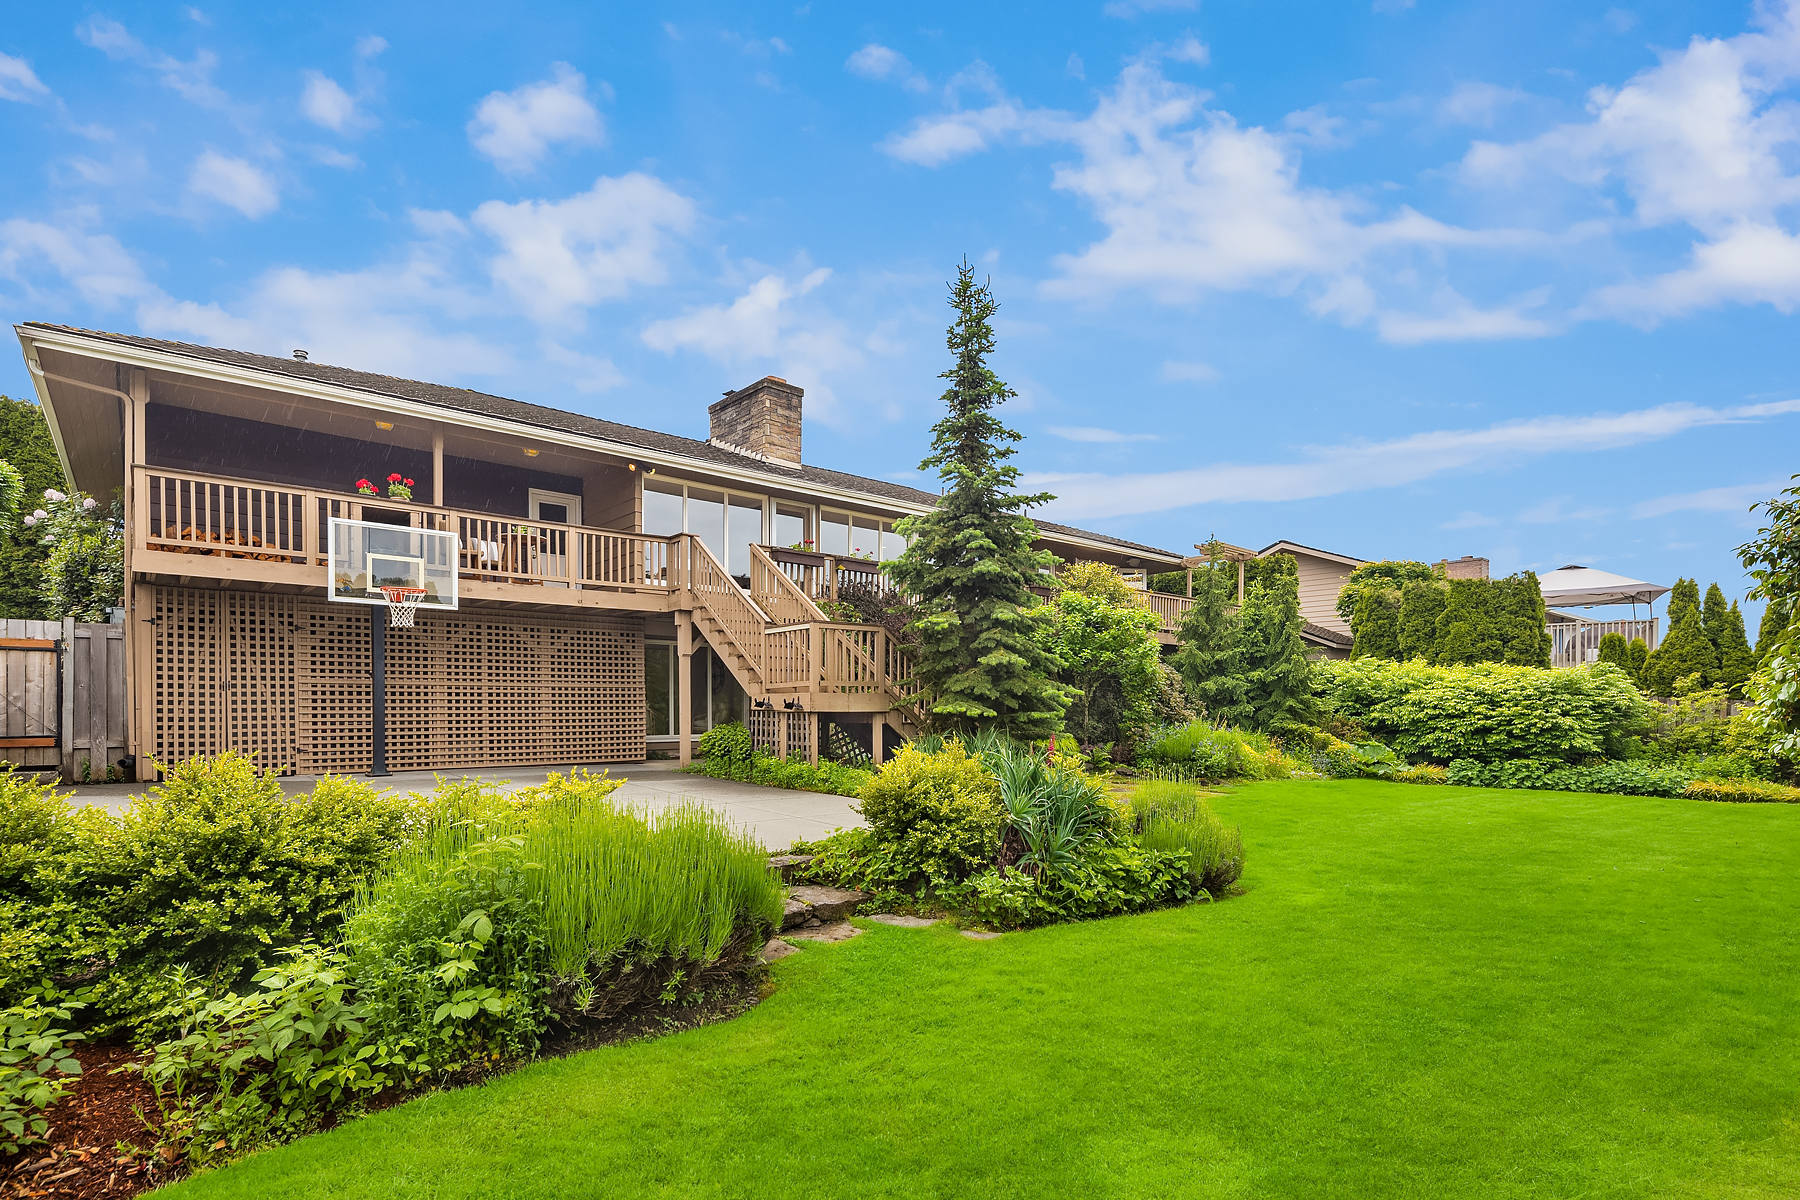
You know it the moment you walk in, this is the home you’ve been waiting for. City and Mountain views set the backdrop for this lovingly cared-for Somerset home. With a centerpiece fireplace, the circular floorplan easily accommodates gathering friends for game night or a meal around the table. A wall of windows naturally draws you outdoors to the park-sized level yard w/perennial gardens, a sports court, and your deck overlooking it all. Quality built mid-century basement rambler with ideal floor plan. Daylight lower level offers plenty of space for fun and function – crafting, creating, working, or relaxing, there is room for it all. Conveniently located to downtown corridors, tech work centers, & top Bellevue Schools. Hurry on this one!
Duvall’s Crestview Estates neighborhood is a peaceful community where you can enjoy evening walks and greet your neighbors. This updated home shows pride of ownership throughout. Fantastic floor plan fits all your needs, huge bonus room and additional den/guest room, set apart from the main bedrooms. Great room concept kitchen allows friends to gather for fireside chats. French doors open to the newer back deck overlooking the established gardens with fruits, veggies, flowers, and producing trees. Windows offer great light while preserving a sense of privacy, looking out on the surrounding trees and mature landscaping. Oversized two-car garage, with additional off-street parking. All near charming shops and restaurants nearby. Check it out!
Style, form & function come together in this updated 2-story home found in one of Bellevue’s most convenient neighborhoods. A beautiful blend of original character with modern touches. The main level features a traditional, circular floor plan with living spaces flowing easily from one to the other, a large updated kitchen with eating space, and a separate family room/bonus. The upstairs boasts 4 good-sized bedrooms and 2 bathrooms, including the large primary suite w/charming nook. Expansive doors and windows bring the outdoors in to showcase a serene, private backyard that exemplifies PNW beauty -including an oversized grassy space, large patio & lush mature landscaping. This house is located centrally in Bellevue for easy access to shopping, restaurants, Tech centers, freeways (520/405/I-90) & soon-to-be Eastside Light Rail (2023-2024). Check it out!
This video is the latest in our Monday with Matthew series with Windermere Chief Economist Matthew Gardner. Each month, he analyzes the most up-to-date U.S. housing data to keep you well-informed about what’s going on in the real estate market.
Hello there. I’m Windermere Real Estate’s Chief Economist Matthew Gardner and welcome to the latest episode of Monday with Matthew. Over the past few months, analysts like myself have been starting to get our hands on early numbers from the Census Bureau and, although we won’t get the bulk of the data for another several months, I thought it would be interesting to take a quick look at some of the information that the government has put out specifically as it relates to patterns.
This is a relevant topic given the pandemic, with many people wondering if we saw a mass shift in where we choose to live because of COVID-19. This belief that we packed up and moved because of the pandemic is, at face value, quite credible, especially given that home sales in 2021 were at levels we haven’t seen since 2006. But the reality, at least from the data we have received so far, actually tells a different story.
Moving Patterns for U.S. Homeowners and Renters in 2021
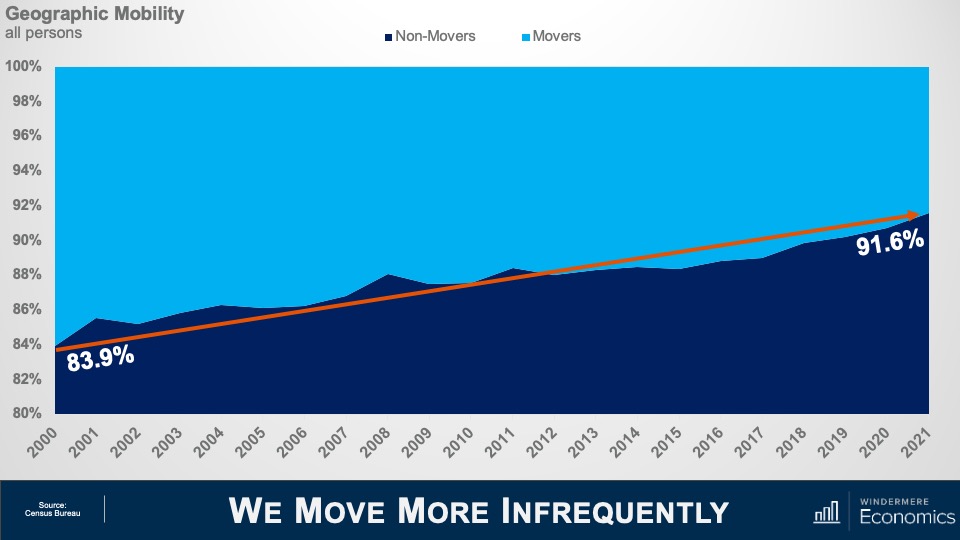
We Move More Infrequently
This first chart looks at people and not households and it shows that, contrary to popular belief, we’re actually moving less frequently now then we have done in decades, with the share of people not moving in a single year rising from just about 84% to over 91½%. Of course, we are having fewer children now than we did, but not to the degree that would change the trend.
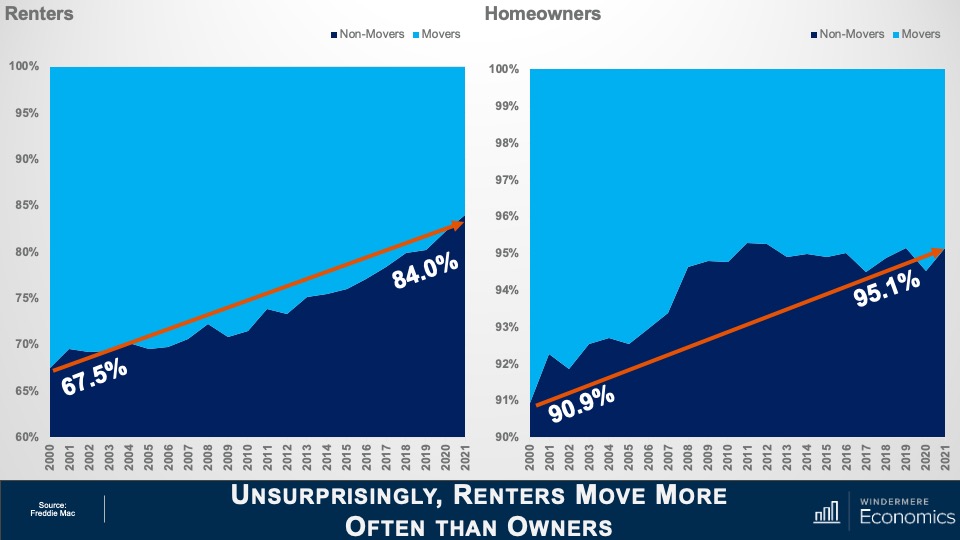
Unsurprisingly, Renters Move More Often than Owners
And when we break this down between homeowners and renters there is quite the discrepancy between the two groups. Although the number of renters not moving has risen from 67½ percent up to 84% since 2000, the number of homeowners staying put has moved from almost 91% all the way up to 95% last year.
So, the data thus far is not suggesting that we saw any form of mass exodus following the pandemic, in fact we haven’t been moving as much for the past 2-decades, but people did move since COVID-19 hit and the reasons they did were fascinating. The following charts are broken up into four categories of movers: those who moved for family reasons; those who moved for employment related reasons; those that moved for housing related reasons; and finally, those that moved for other reasons.
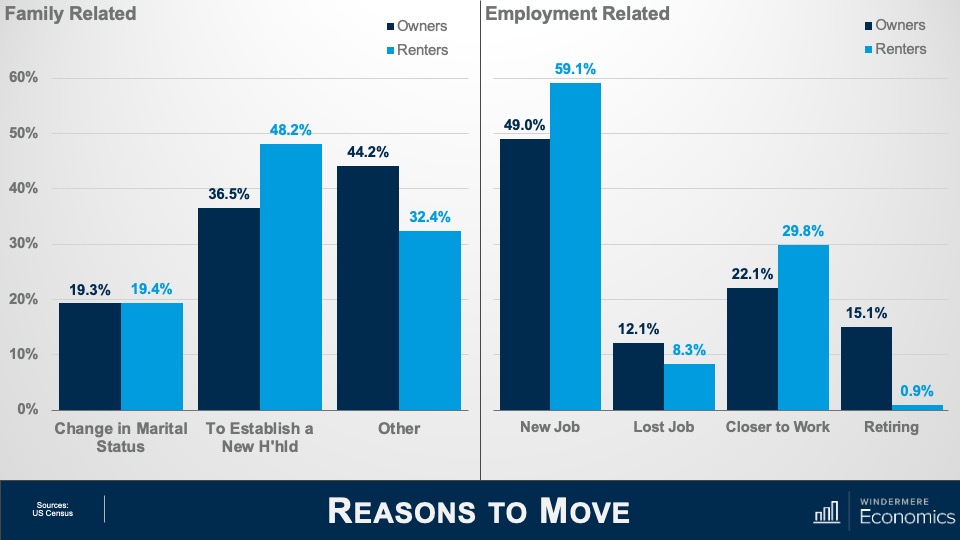
Reasons to Move (1)
So, starting with family-related reasons, it was not surprising to see the major reason for both owners and renters to move was to establish a new household, nor was it surprising to see a greater share of renters headed out on their own than homeowners. Finally, the share of those moving because of a change in marital status was essentially the same between renters and homeowners. And when we look at employment related reasons for people moving last year, a greater share of renters moved because of a new job than homeowners, and more renters moved to be closer to their workplaces than did homeowners. Again, not really surprising, given that a large share of renters work in service-based industries and therefore proximity to their workplaces is important. You will also see that a greater share of homeowners than renters moved because they lost their jobs and, finally—and not at all surprisingly—far more homeowners moved because they chose to retire than renters.
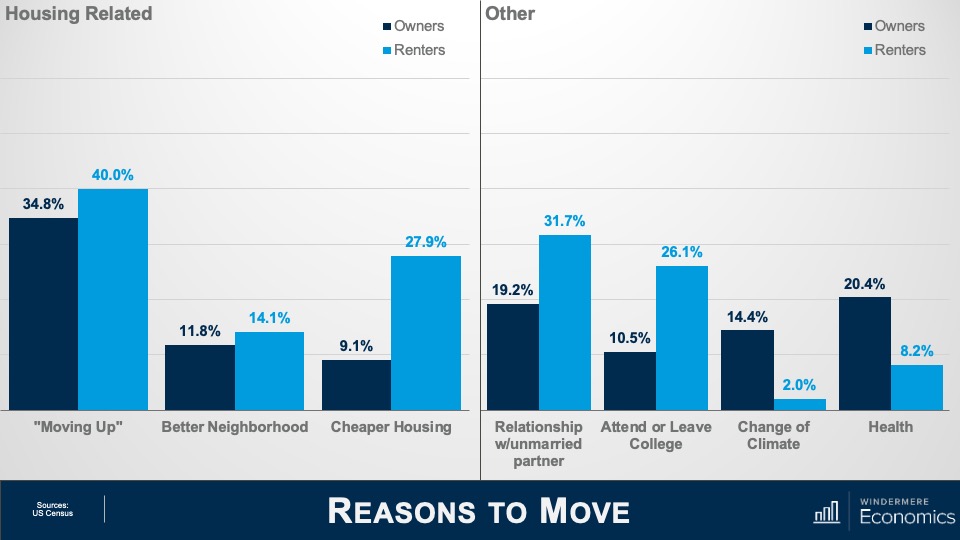
Reasons to Move (2)
And when we look at housing related reasons that people moved, a large share of owners and renters moved from their current home or apartment and into a new, bigger, better house or apartment. A statistically significant share looked to move into a better neighborhood, and I do wonder whether owners were doing this because of the ability to work from home and possibly move to a better location further away from their workplaces. And even though renters tend to stay closer to their workplaces, I wonder whether these renters weren’t in white-collar industries and that the ability to work from home has led them to move into an area that they perceive to be better suited to them.
And finally, a significant share of renters moved because of the fact that rents have been skyrocketing over the past 18-months or so. This clearly impacted some homeowners, too. And finally, under the “other” category, more renters than owners moved because they were either entering or exiting a relationship with a domestic partner, and more renters left to either go to college or because they had completed their degrees.
Health-related reasons for moving had a significant impact on homeowners over renters, and I found it particularly interesting to see a lot of owners saying that “climate” was a reason for their move. Of course, I can only hypothesize as to whether people are simply looking to move to warmer climates or whether climate change is starting to have an increasingly large influence on where we choose to live. My gut tells me that climate change is becoming a far more important consideration for homeowners, although we can’t deny that a lot of people, specifically on the East Coast, moved South during the pandemic.
These next few charts break down movers not just by whether they our owners or renters but also by ethnicity.
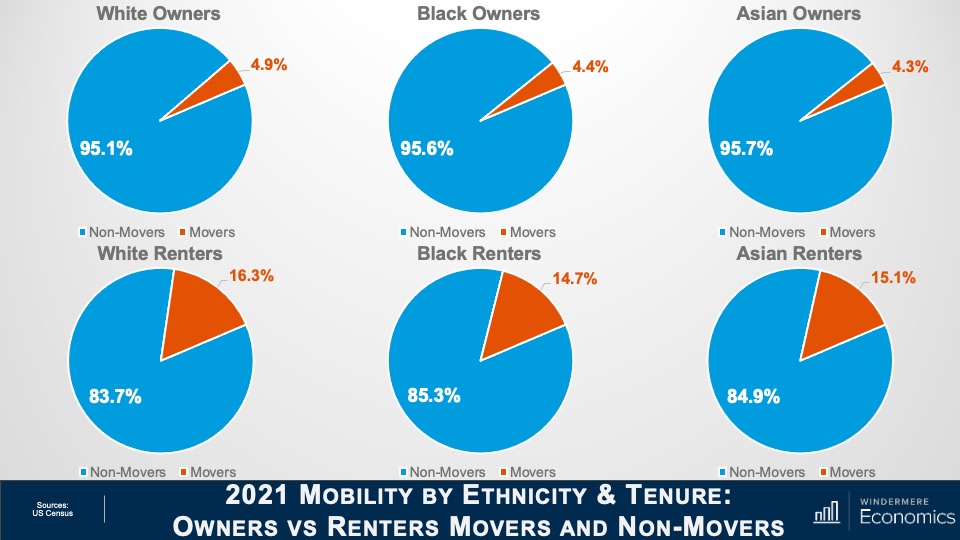
2021 Mobility by Ethnicity & Tenure: Owners vs Renters Movers and Non-Movers
Here you can see that homeowners across these three ethnicities were pretty much uniform in their desire to stay in their existing home with only 4 to 5% moving. And renters who, as we have already seen, did move more frequently last year than homeowners, were also in a very tight range at between 83 and 85%.
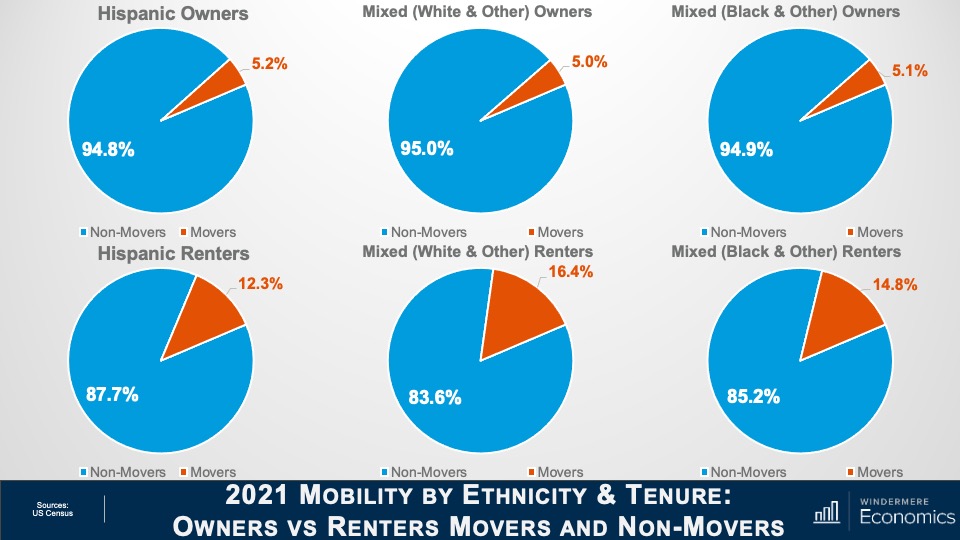
2021 Mobility by Ethnicity & Tenure: Owners vs Renters Movers and Non-Movers (2)
And the same can be said about Hispanic owners and mixed race families, with about 95% not moving last year. Now this is modestly lower than White, Black, or Asian households, but the difference is very marginal. As for renters, between 83 and almost 88% of them within these three ethnicities moved last year, but you will see a bigger share of Hispanic renters stayed put as opposed to all the other ethnicities shown here.
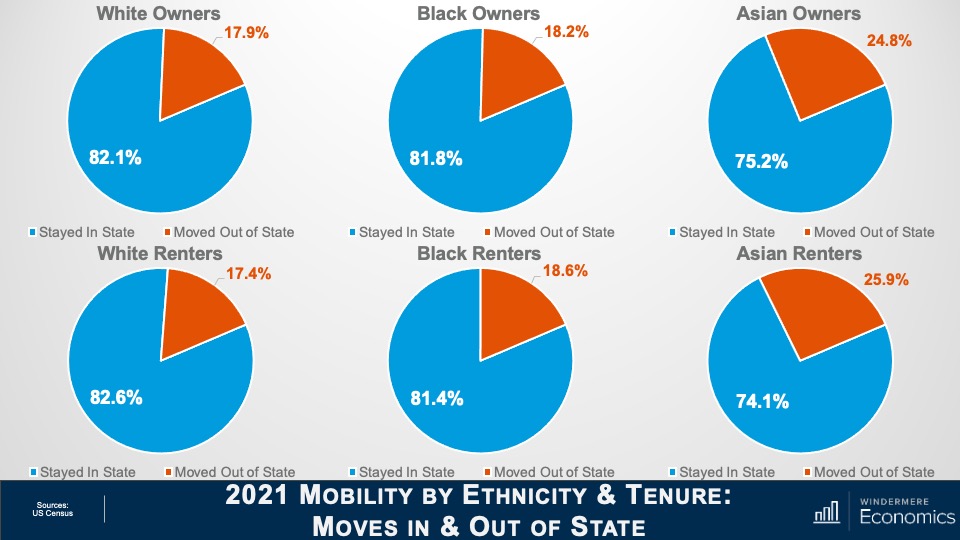
2021 Mobility by Ethnicity & Tenure: Moves In & Out of State
Looking closer now at those who did move, even though fewer Asian households moved when compared to all other ethnicities, far more left the state than stayed, and the same was true for Asian renters with over a quarter moving out of state.
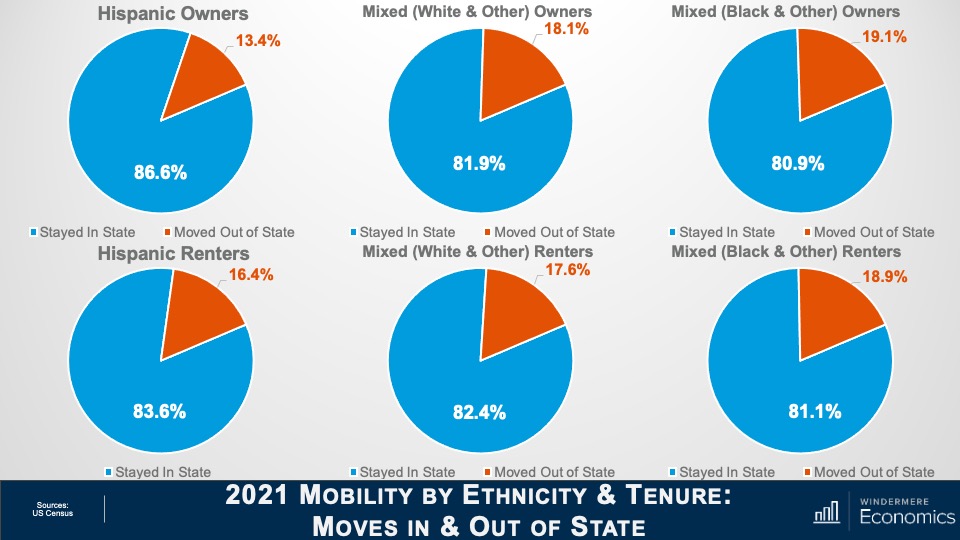
2021 Mobility by Ethnicity & Tenure: Moves In & Out of State (2)
Again, a greater share of the Hispanic homeowners who did move last year stayed in the state where their old house was, and the share of mixed households was roughly at the average for all ethnicities. And the share of Hispanic and mixed-race renters who stayed in State was also about average.
What I see from the data is that the huge shift that many expected during COVID has not been affirmed—at least not by the numbers we have looked at. That said, we are sure to see numerous revisions because of the issues that COVID 19 has posed on Census takers, so we may get a different story as more data is released and revisions posted. What I found to be most interesting in the numbers we have looked at was the massive increase in renters moving in with their “significant others.” But I am not surprised, given that there are around 48½ million people aged between 20 and 30, and this is their time!
And I was also interested in the share of the population who moved due to climate. I will be doing some more digging around in the darkest recesses of the Census Bureau website to see if I can find out more about this. Although I can’t confirm it, my gut tells me that climate—and specifically climate change—will be a factor of growing importance when people are thinking about where they want to live.
And there you have it. As always, if you have any questions or comments about this particular topic, please do reach out to me but, in the meantime, stay safe out there and I look forward to visiting with you all again next month.
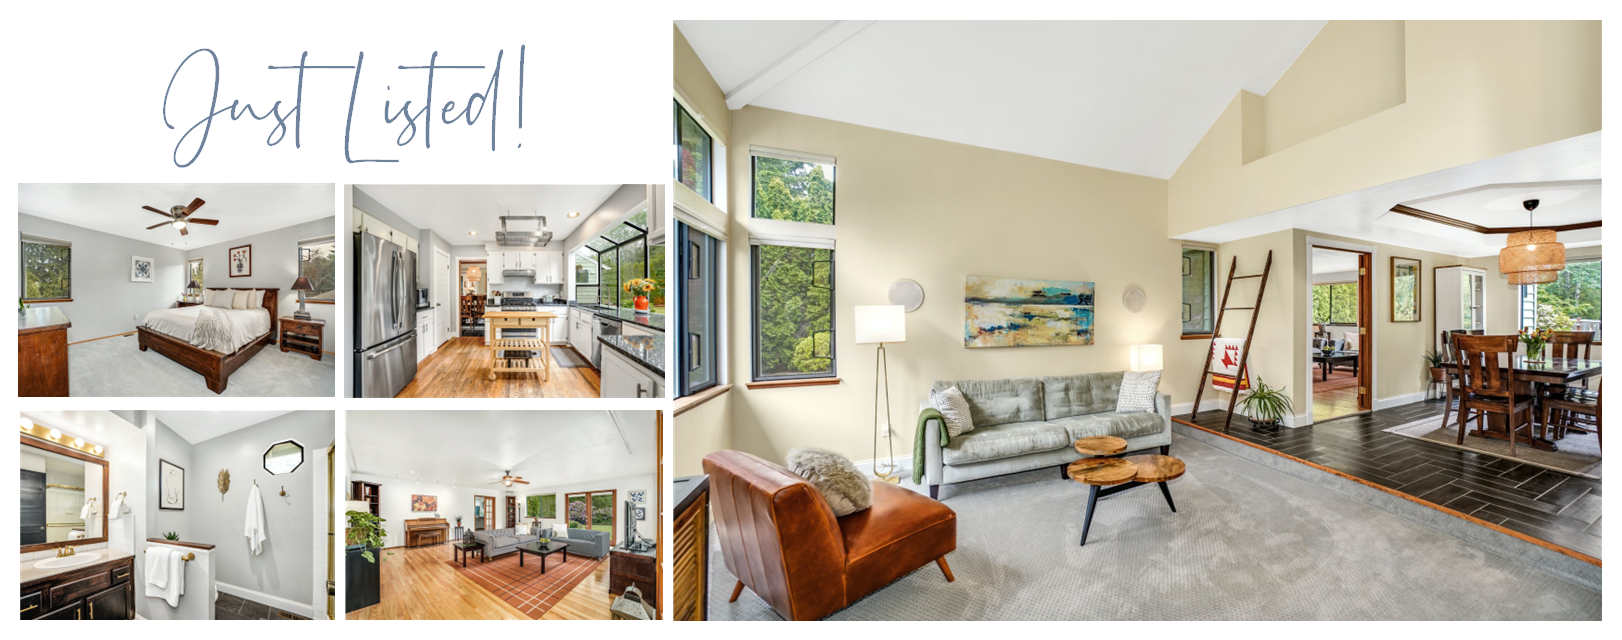
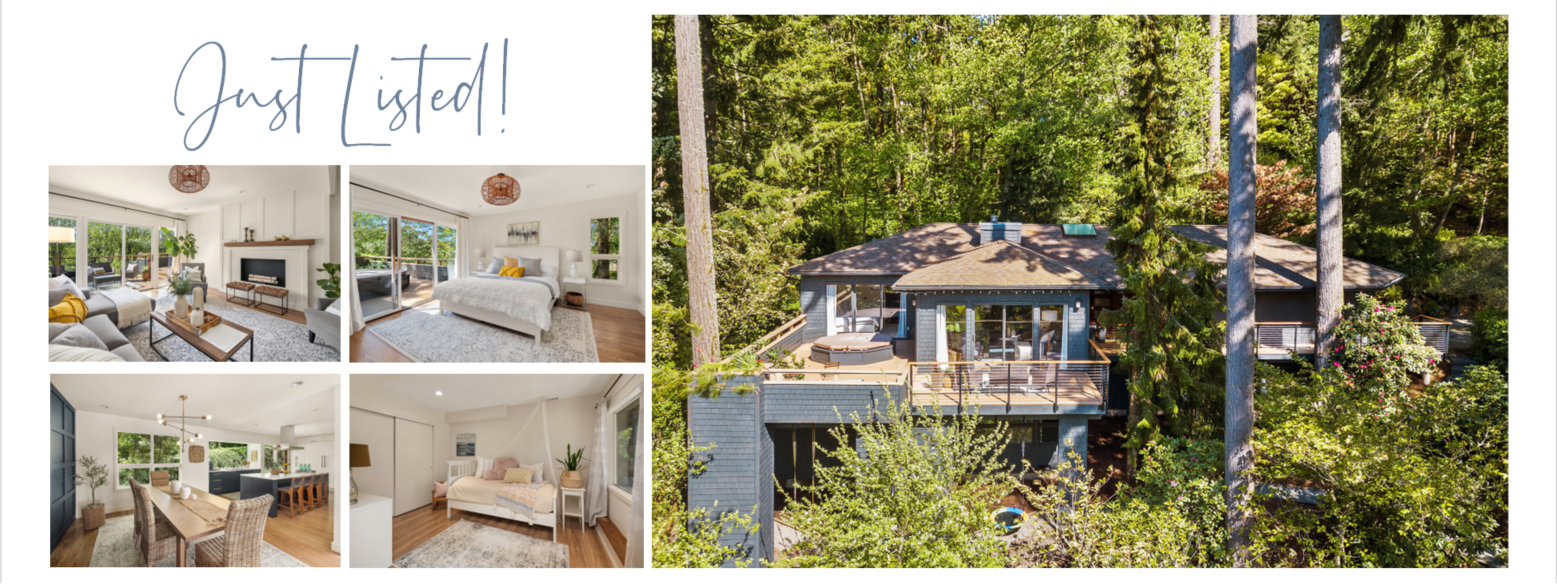
Architectural Digest meets NW Contemporary in the center of your private arboretum in Somerset. Completely remodeled main floor, a beautiful combination of form & function including extensive hardwood flooring, Chef’s kitchen with Miele appliances & spa-like Primary bath shower & sauna. Main floor level entry w/ living spaces enhanced by the beauty of the surrounding nature – feels like you’re in a chic, modern treehouse. Main level Primary suite w/deck access. The lower level includes a bonus room, 3 additional bedrooms, an office/flex room & bath. A large, lush lot with mature landscaping & expansive deck provides plenty of room for entertaining & play! Super convenient location with coveted Somerset Elem, Tyee & Newport High. Easy access to 1-90 & 405! Check it out!
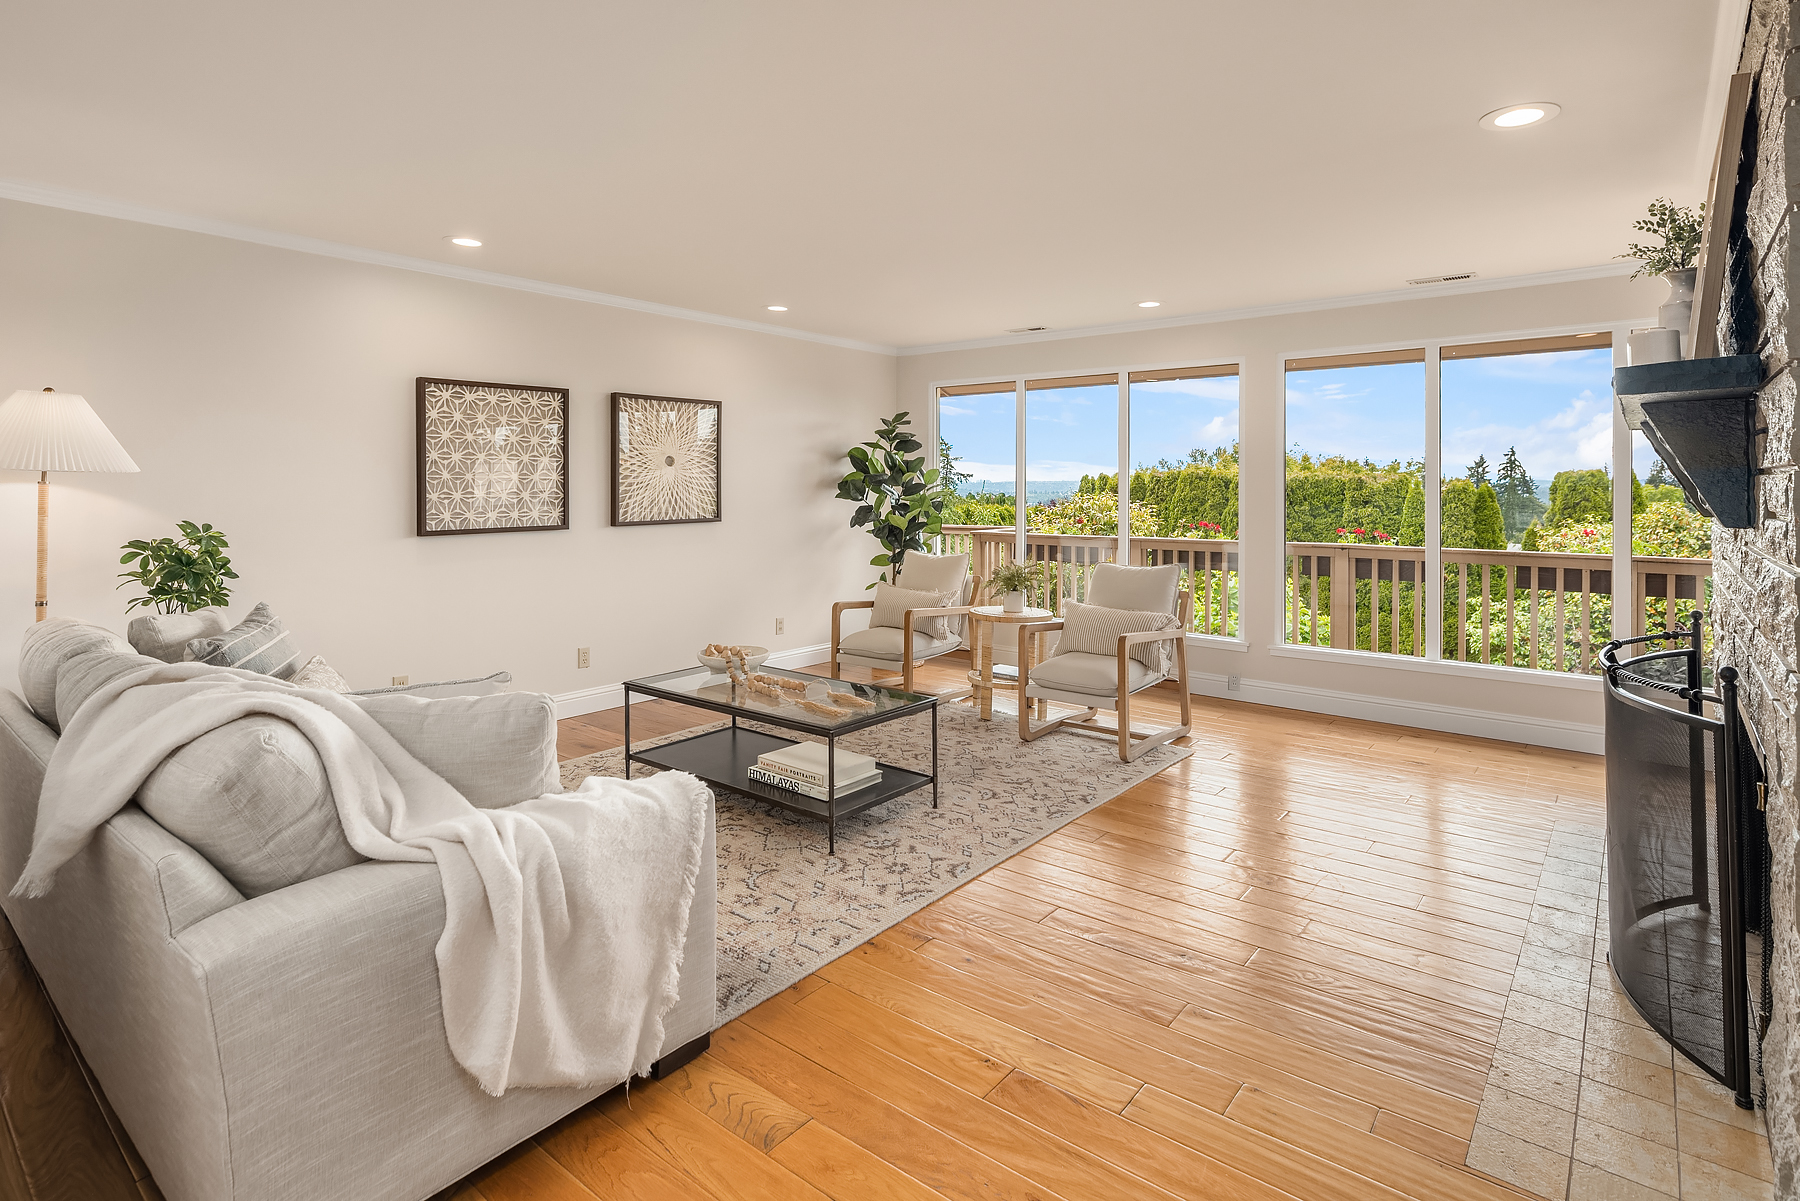
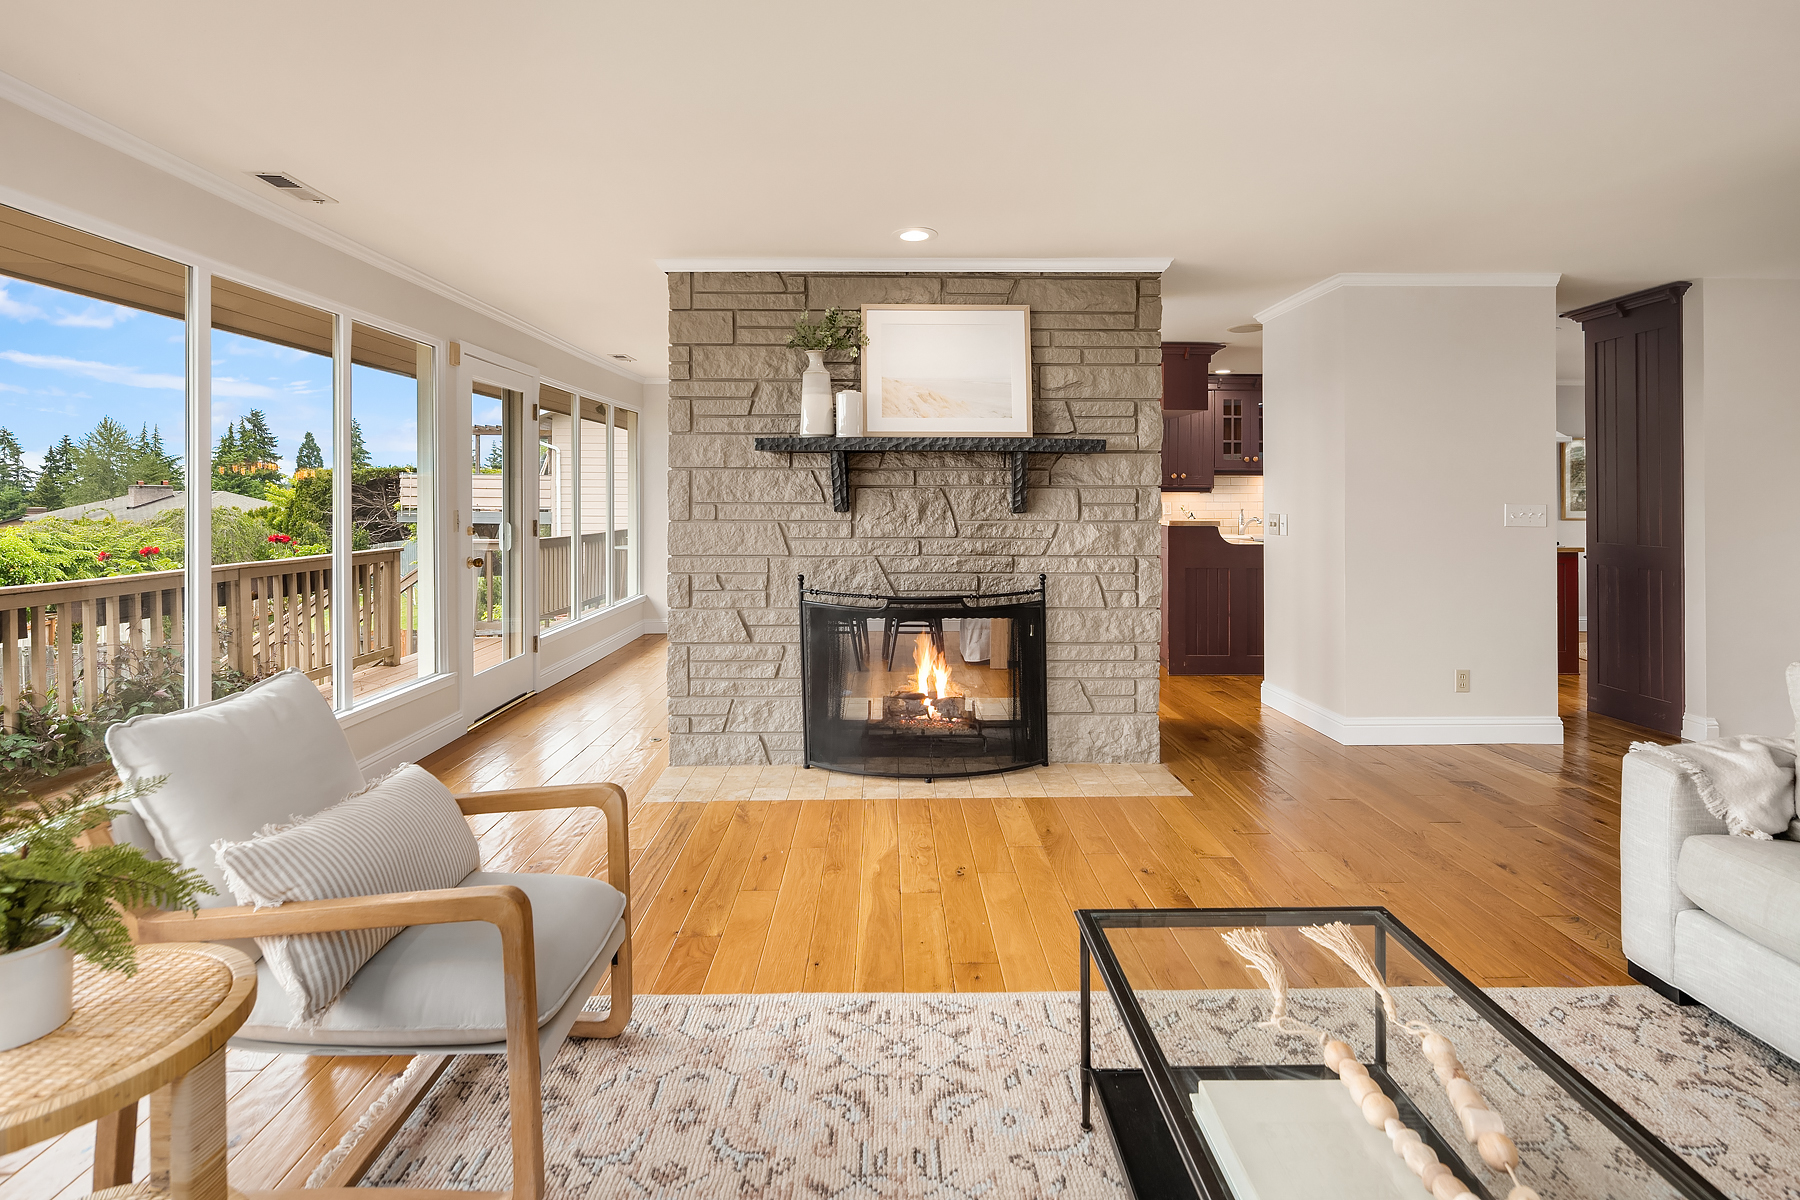
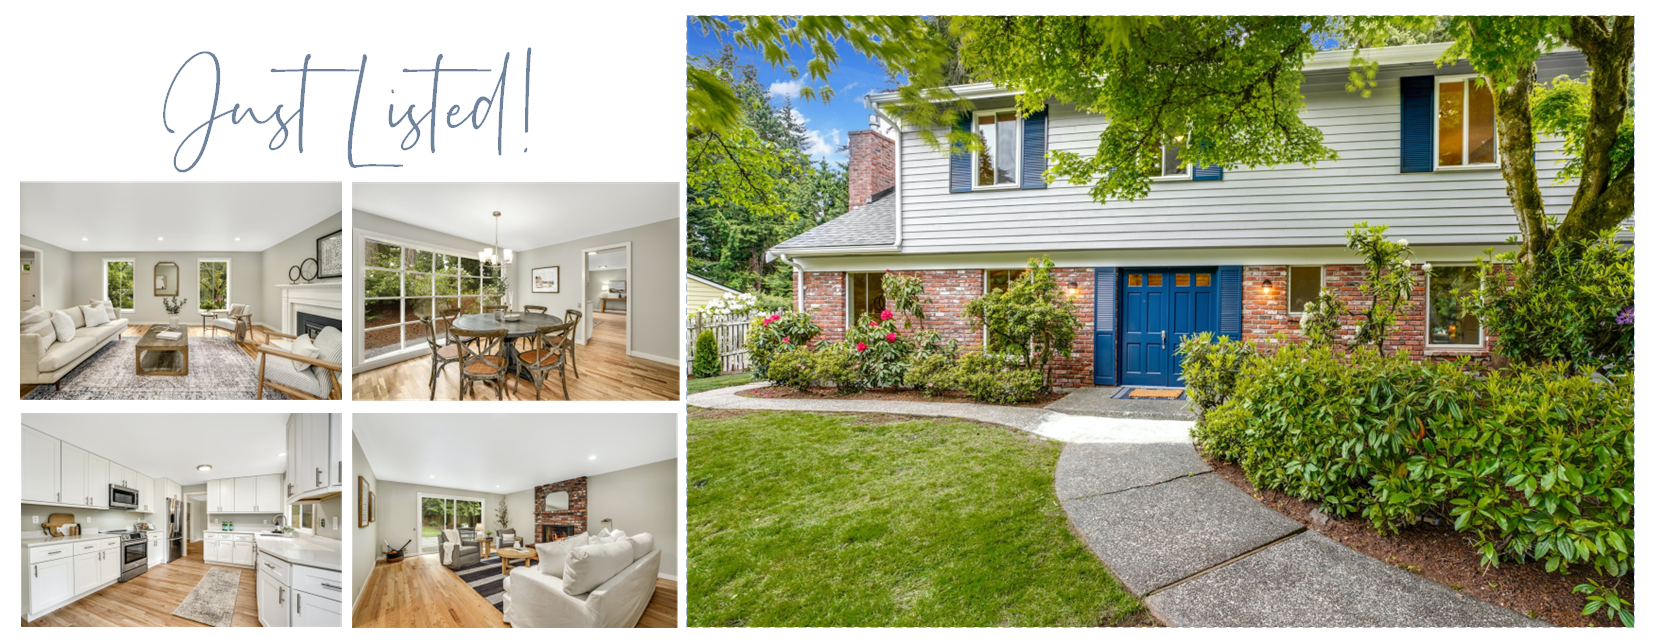
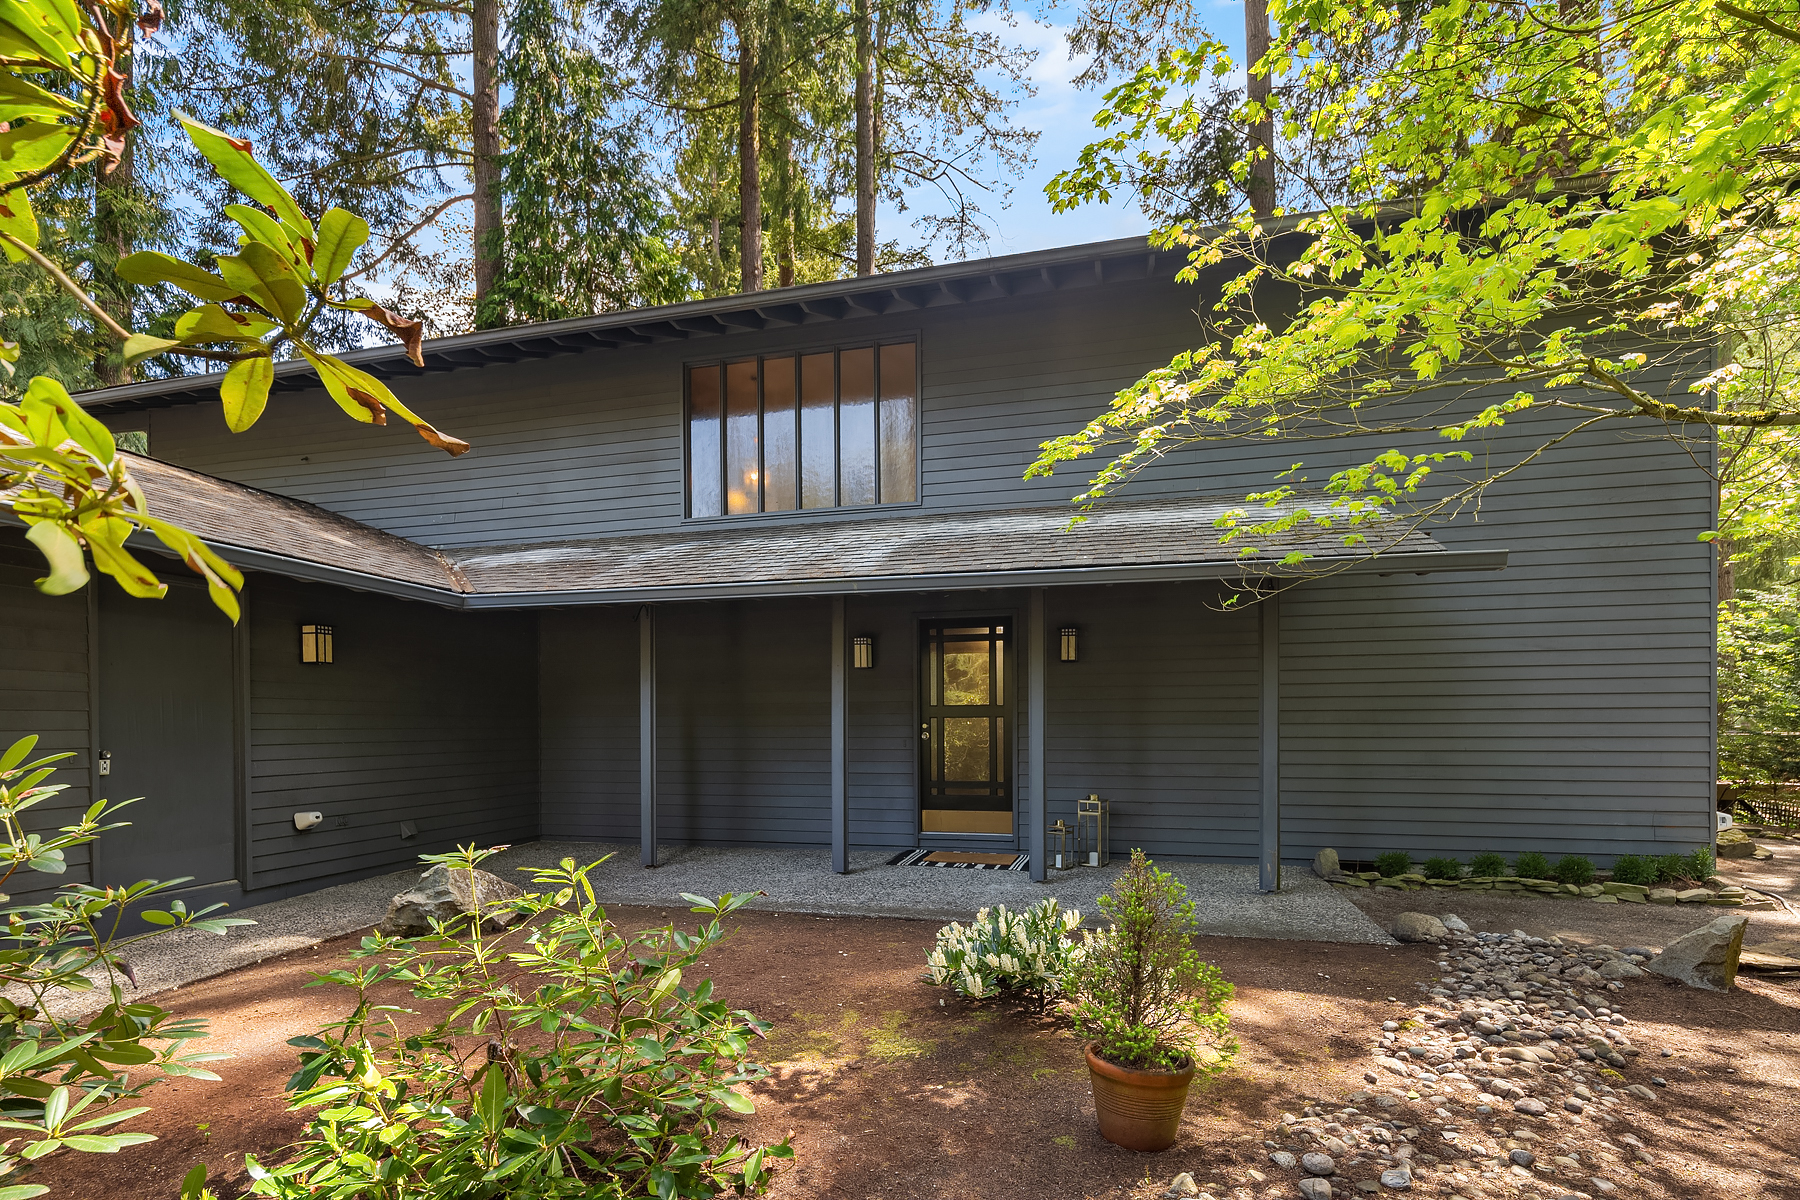
Early Ralph Anderson designed a two-story home tucked away in a quiet, tree-lined neighborhood in the heart of Bellevue. A perfect blend of Pacific Northwest craftsmanship & mid-century charm. Clean lines & large windows mixed with natural elements throughout. The aggregate flooring & floating staircase upon entry immediately convey the unique character of this home. Main floor living spaces enjoy natural light through walls of windows. Primary suite upstairs plus 3 additional bedrooms & hall bath. A bonus flex room on the main level is a great extra space to use as an office, TV room, craft/hobby space, or possibly open to the kitchen & family room. All rooms are designed to overlook the private backyard sanctuary & surrounding nature.
An unbeatable location provides a peaceful, tranquil setting just minutes from Bellevue’s downtown & tech core, freeways, light rail (expected 2023-2024) & more. Highly rated schools including newer Wilburton Elementary, Chinook Middle School & Bellevue High School. This home has been loved by one family for the past 30 years. Now is your opportunity to make this special home your own. Check it out!
This video is the latest in our Monday with Matthew series with Windermere Chief Economist Matthew Gardner. Each month, he analyzes the most up-to-date U.S. housing data to keep you well-informed about what’s going on in the real estate market.
Hello there, I’m Windermere’s Chief Economist Matthew Gardner, and welcome to this month’s episode of Monday with Matthew. With home prices continuing to defy gravity, mortgage rates spiking, the Fed raising interest rates significantly, a yield curve that is just keeping its nose above water, and some becoming vocal about the possibility that we are going to enter a recession sooner rather than later, it’s not at all surprising that many of you have been asking me whether the housing market is going to pull back significantly, and a few of you have asked whether we aren’t in some sort of “bubble” again.
Because this topic appears to be giving many of you heartburn, I decided that it’s a good time to reflect on where the housing market is today and give you my thoughts on the impact of rising mortgage rates on what has been an historically hot market.
The Current State of the U.S. Housing Market
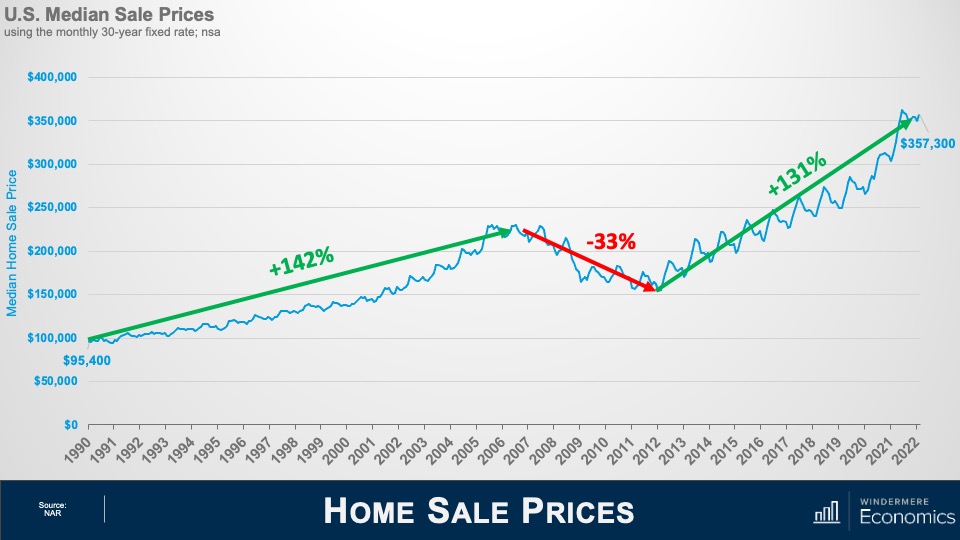
Home Sale Prices
As usual, a little perspective. Between 1990 and the pre-bubble peak in 2006, home prices rose by 142%, which was a pretty impressive annual increase of 5.6% over a 16 1/2-year period. When the market crashed, prices dropped by 33%, but from the 2012 low to today, prices have risen by 131%, or at an even faster annual rate of 8.6% over a shorter period of time—10 years.
You may think that prices rising at an annual rate that exceeds the pace seen before the market crash is what has some brokers and home buyers concerned, but that really isn’t what has many people scared. It’s this.
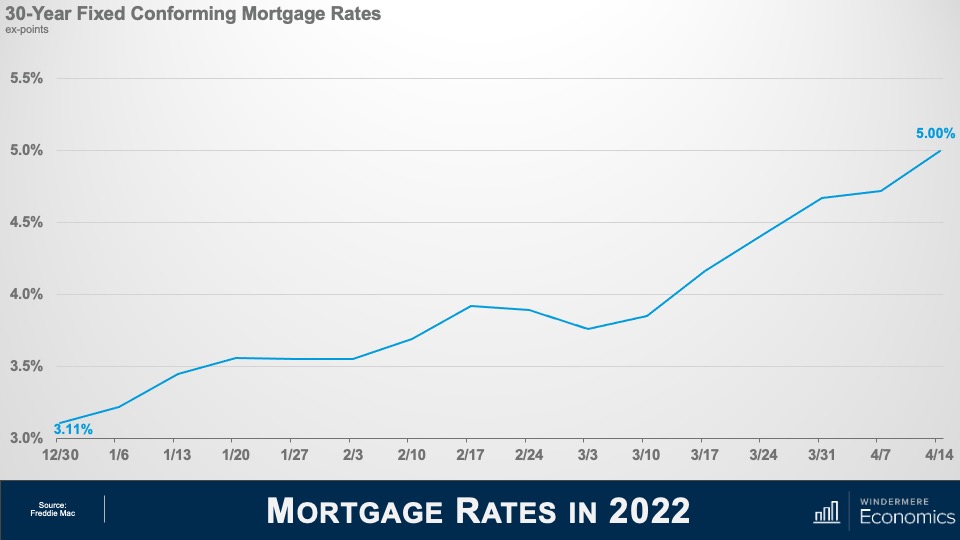
Mortgage Rates in 2022
At the start of 2022, the average 30-year fixed mortgage rate was just a little above 3%. But, over a brief 15-week period, they have skyrocketed to 5%. This has led some to worry that the market is about to implode. Of course, nobody can say that the run-up in home prices hasn’t been phenomenal over the past few years, and it’s certainly human nature to think that “what goes up, must come down,” but is there really any reason to panic? I think not, and to explain my reasoning, let’s look back in time to periods when rates rose significantly and see how increasing mortgage rates impacted the marketplace.
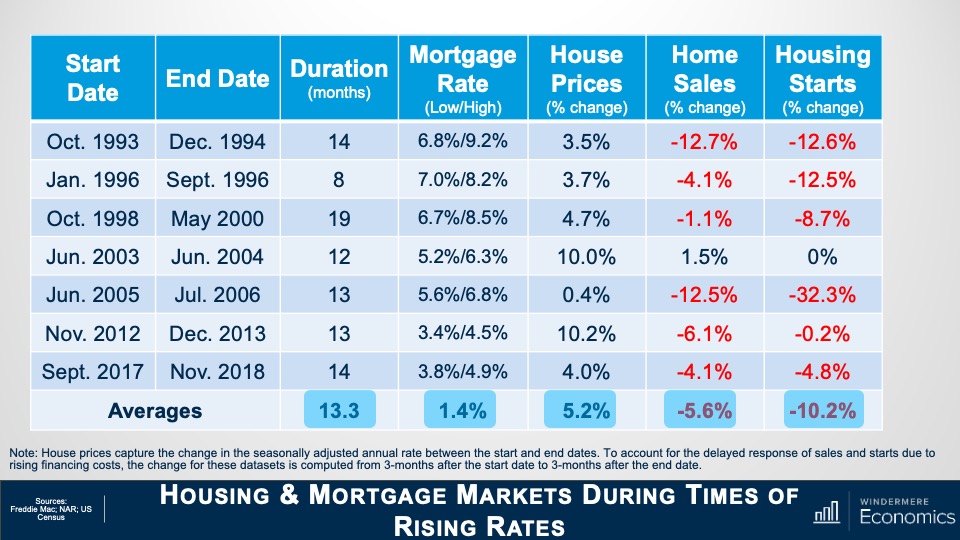
Housing and Mortgage Markets During Times of Rising Rates
This table shows seven periods over the past 30 years when mortgage rates rose significantly. On average, rates trended higher for just over a year before pulling back, and the average increase was 1.4%. But now look at how it impacted home prices: it really didn’t. On average, during these periods of rising financing costs, home prices still rose by just over 5%. Clearly, not what some might have expected. But there were some negatives from mortgage rates trending higher, and these came in the form of lower sales in all but one period and new housing starts also pulled back.
So, if history is any indicator, the impact of the current jump in mortgage rates is likely to be seen in the form of lower transactions rather than lower prices. And this makes sense. Although rising financing costs puts additional pressure on housing affordability, what people don’t appear to think about is that mortgage rates actually tend to rise during periods of economic prosperity. And what does a flourishing economy bring? That’s right. Rising wages. Increasing incomes can certainly offset at least some of the impacts of rising mortgage rates.
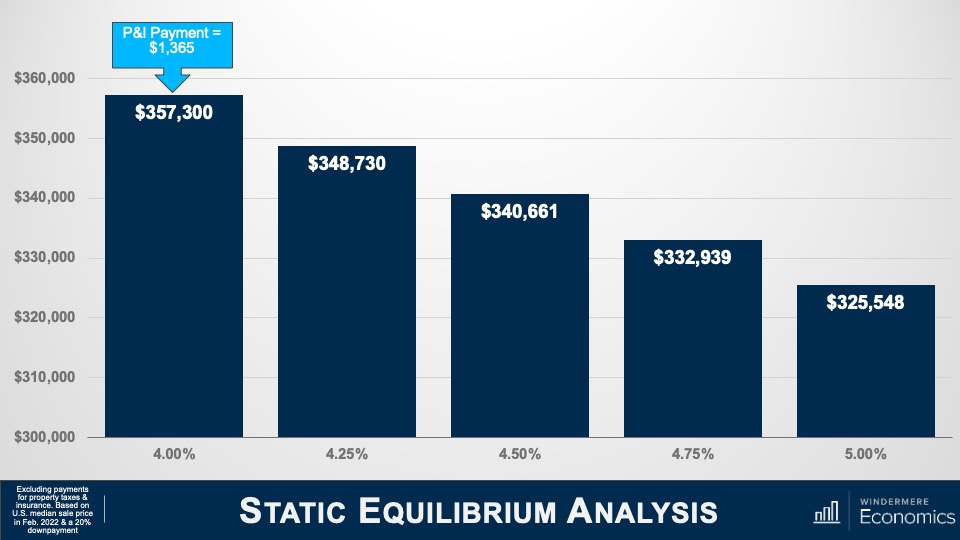
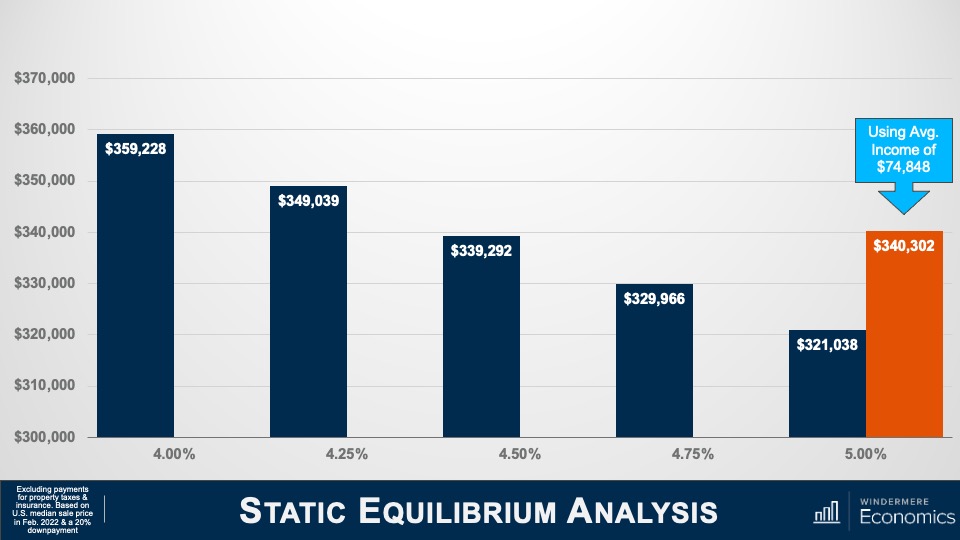
Static Equilibrium Analysis – 1/3
To try and explain this, I’m using the median US sale price in February of this year, assuming a 20% down payment and the mortgage rate of 4%. And you can see that the monthly P&I payment would be $1,365. But as mortgage rates rise, and if buyers wanted to keep the same monthly payment, then they would have to buy a cheaper home. Using a rate of 5%, a buyer could afford a home that was 9% cheaper if they wanted to keep the payment the same as it would have been if rates were still at 4%.
But, as I mentioned earlier, an expanding economy brings higher wages, and this is being felt today more than usual, given the worker shortage that exists and businesses having to raise compensation. Average weekly wages have risen by over five-and-a-half percent over the past year—well above the pre-pandemic average of two-and-a-half percent. Although increasing incomes would not totally offset rising mortgage rates, it does have an impact.
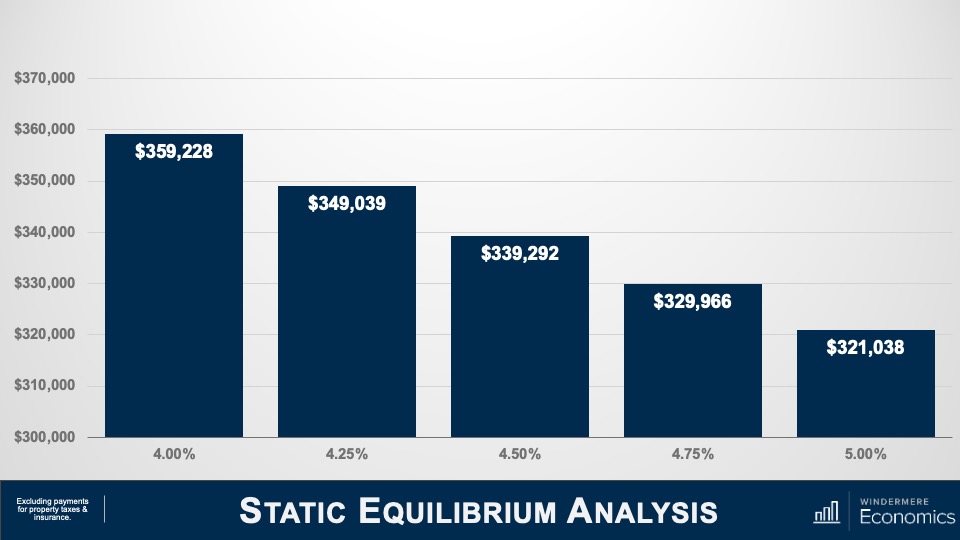
Static Equilibrium Analysis – 2/3
To demonstrate this, let’s use the U.S. average household income of $70,611. Assuming that they’ve put aside 20% of their gross income for a down payment, they could afford a home priced just under $360,000 if mortgage rates were at 4%. As rates rise—and assuming that their income doesn’t—their buying power is reduced by over 10%, or just over $38,000.
Static Equilibrium Analysis – 3/3
But if we believe that incomes will rise, then the picture looks very different. Assuming wages rise by 6%, their buying power drops by just 5% if rates rose from 4% to 5%, or a bit less than $19,000.
Although rates have risen dramatically in a short period, because they started from an historic low, the overall impacts are not yet very significant. If history is any indicator, mortgage rates increasing are likely to have a more significant impact on sales, but a far smaller impact on prices.
But there are other factors that come into play, too. Here I’m talking about demand. The only time since 1968 that home prices have dropped on an annualized basis was in 2007 through 2009 and in 2011, and this was due to a massive increase in the supply of homes for sale. When supply exceeds demand, prices drop.
So, how is it different this time around? Well, we know that the supply glut that we saw starting to build in mid-2006 was mainly not just because households were getting mortgages that, quite frankly, they should never have gotten in the first place, but a very large share held adjustable rate mortgages which, when the fixed interest rate floated, they found themselves faced with payments that they could not afford. Many homeowners either listed their homes for sale or simply walked away.
Although it’s true that over the past two or so months more buyers have started taking ARMs as rates rose, it’s not only a far smaller share than we saw before the bubble burst, but down payments and credit quality remained far higher than we saw back then.
So, if we aren’t faced with a surge of inventory, I simply don’t see any reason why the market will see prices pull back significantly. But even if we do see listing activity increase, I still anticipate that there will be more than enough demand from would-be buyers. I say this for several reasons, the first of which is inflation.
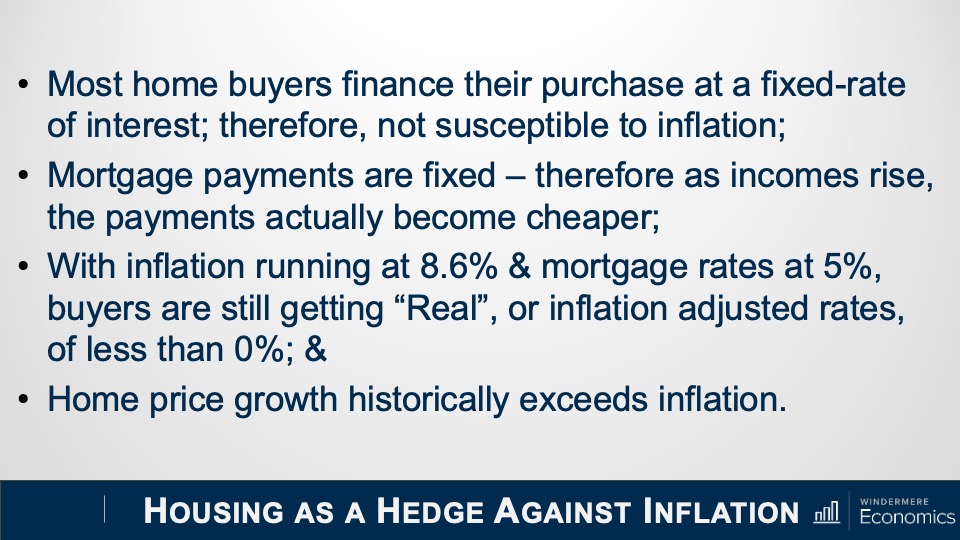
What a lot of people aren’t talking about is the proven fact that owning real estate is a significant hedge against rising inflation. You see, most buyers have a mortgage, and a vast majority use fixed-rate financing. This is the hedge because even as consumer prices are rising, a homeowner’s monthly payments aren’t. They remain static and, more than that, their monthly payments actually become lower over time as the value of the dollar diminishes. Simply put, the value of a dollar in—let’s say 2025—will be lower than the value of a dollar today.
But this isn’t the only reason that inflation can actually stimulate the housing market. Home prices historically have grown at a faster pace than inflation.
Hedge Against Inflation
This chart looks at the annual change in total CPI going back to 1969. Now let’s overlay the annual change in median U.S. home prices over the same time period. Other than when home prices crashed with the bursting of the housing bubble, for more than fifty years home price growth has outpaced inflation. And this means we are offsetting high consumer prices because home values are increasing at an even faster rate.
But inflation has additional impacts on buyers. Now I’m talking about savings. As we all know, the interest paid on savings today is pretty abysmal. In fact, the best money market accounts I could find were offering interest rates between 0.5% and 0.7%. And given that this is significantly below the rate of inflation, it means that dollars saved continue to be worth less and less over time while inflation remains hot.
Now, rather than watching their money drop in value because of rising prices, it’s natural that households would look to put their cash to work by investing in assets where the return is above the rate of inflation—meaning that their money is no longer losing value—and where better place to put it than into a home.
Housing as a Hedge Against Inflation
So, the bottom line here is that inflation supports demand from home buyers because:
Most are borrowing at a fixed rate that will not be impacted by rising inflation
Monthly payments are fixed, and these payments going forward become lower as incomes rise, unlike renters out there who continue to see their monthly housing costs increase
With inflation at a level not seen since the early 1980s, borrowers facing 5% mortgage rates are still getting an amazing deal. In fact, by my calculations, mortgage rates would have to break above 7% to significantly slow demand, which I find highly unlikely, and
If history holds true, home price appreciation will continue to outpace inflation
Demand appears to still be robust, and supply remains anemic. Although off the all-time low inventory levels we saw in January, the number of homes for sale in March was the lowest of any March since record keeping began in the early 1980’s.
But even though I’m not worried about the impact of rates rising on the market in general, I do worry about first-time buyers. These are households who have never seen mortgage rates above 5% and they just don’t know how to deal with it! Remember that the last time the 30-year fixed averaged more than 5% for a month was back in March of 2010!
And given the fact that these young would-be home buyers have not benefited from rising home prices as existing homeowners have, as well as the fact that they are faced with soaring rents, making it harder for them to save up for a down payment on their first home, many are in a rather tight spot and it’s likely that rising rates will lower their share of the market.
So, the bottom line as far as I am concerned is that mortgage rates normalizing should not lead you to feel any sort of panic, and that current rates are highly unlikely to be the cause of a market correction.
And I will leave you with this one thought. If you agree with me that a systemic drop in home prices has to be caused by a significant increase in supply, and that buyers who are currently taking out adjustable-rate mortgages are more qualified, and therefore able to manage to refinance their homes when rates do revert at some point in the future, then what will cause listings to rise to a point that can negatively impact prices?
It’s true that a significant increase in new home development might cause this, but that is unlikely. And as far as existing owners are concerned, I worry far more about a prolonged lack of inventory. I say this for one very simple reason and that is because a vast majority off homeowners either purchased when mortgage rates were at or near their historic lows, or they refinanced their current homes when rates dropped.
And this could be the biggest problem for the market. Even if rates don’t rise at all from current levels, I question how many owners would think about selling if they were to lose the historically low mortgage rates that they have locked into. It is quite possible that for this one reason, we may experience a tight housing market for several more years.
As always, if you have any questions or comments about this particular topic, please do reach out to me but, in the meantime, stay safe out there and I look forward to visiting with you all again next month.
 Facebook
 X
X
 Pinterest
 Copy Link